Smartphone Diagnosis of Wheel Hum: Sequential Vibration Analysis of Audi Q7 using AI Claude
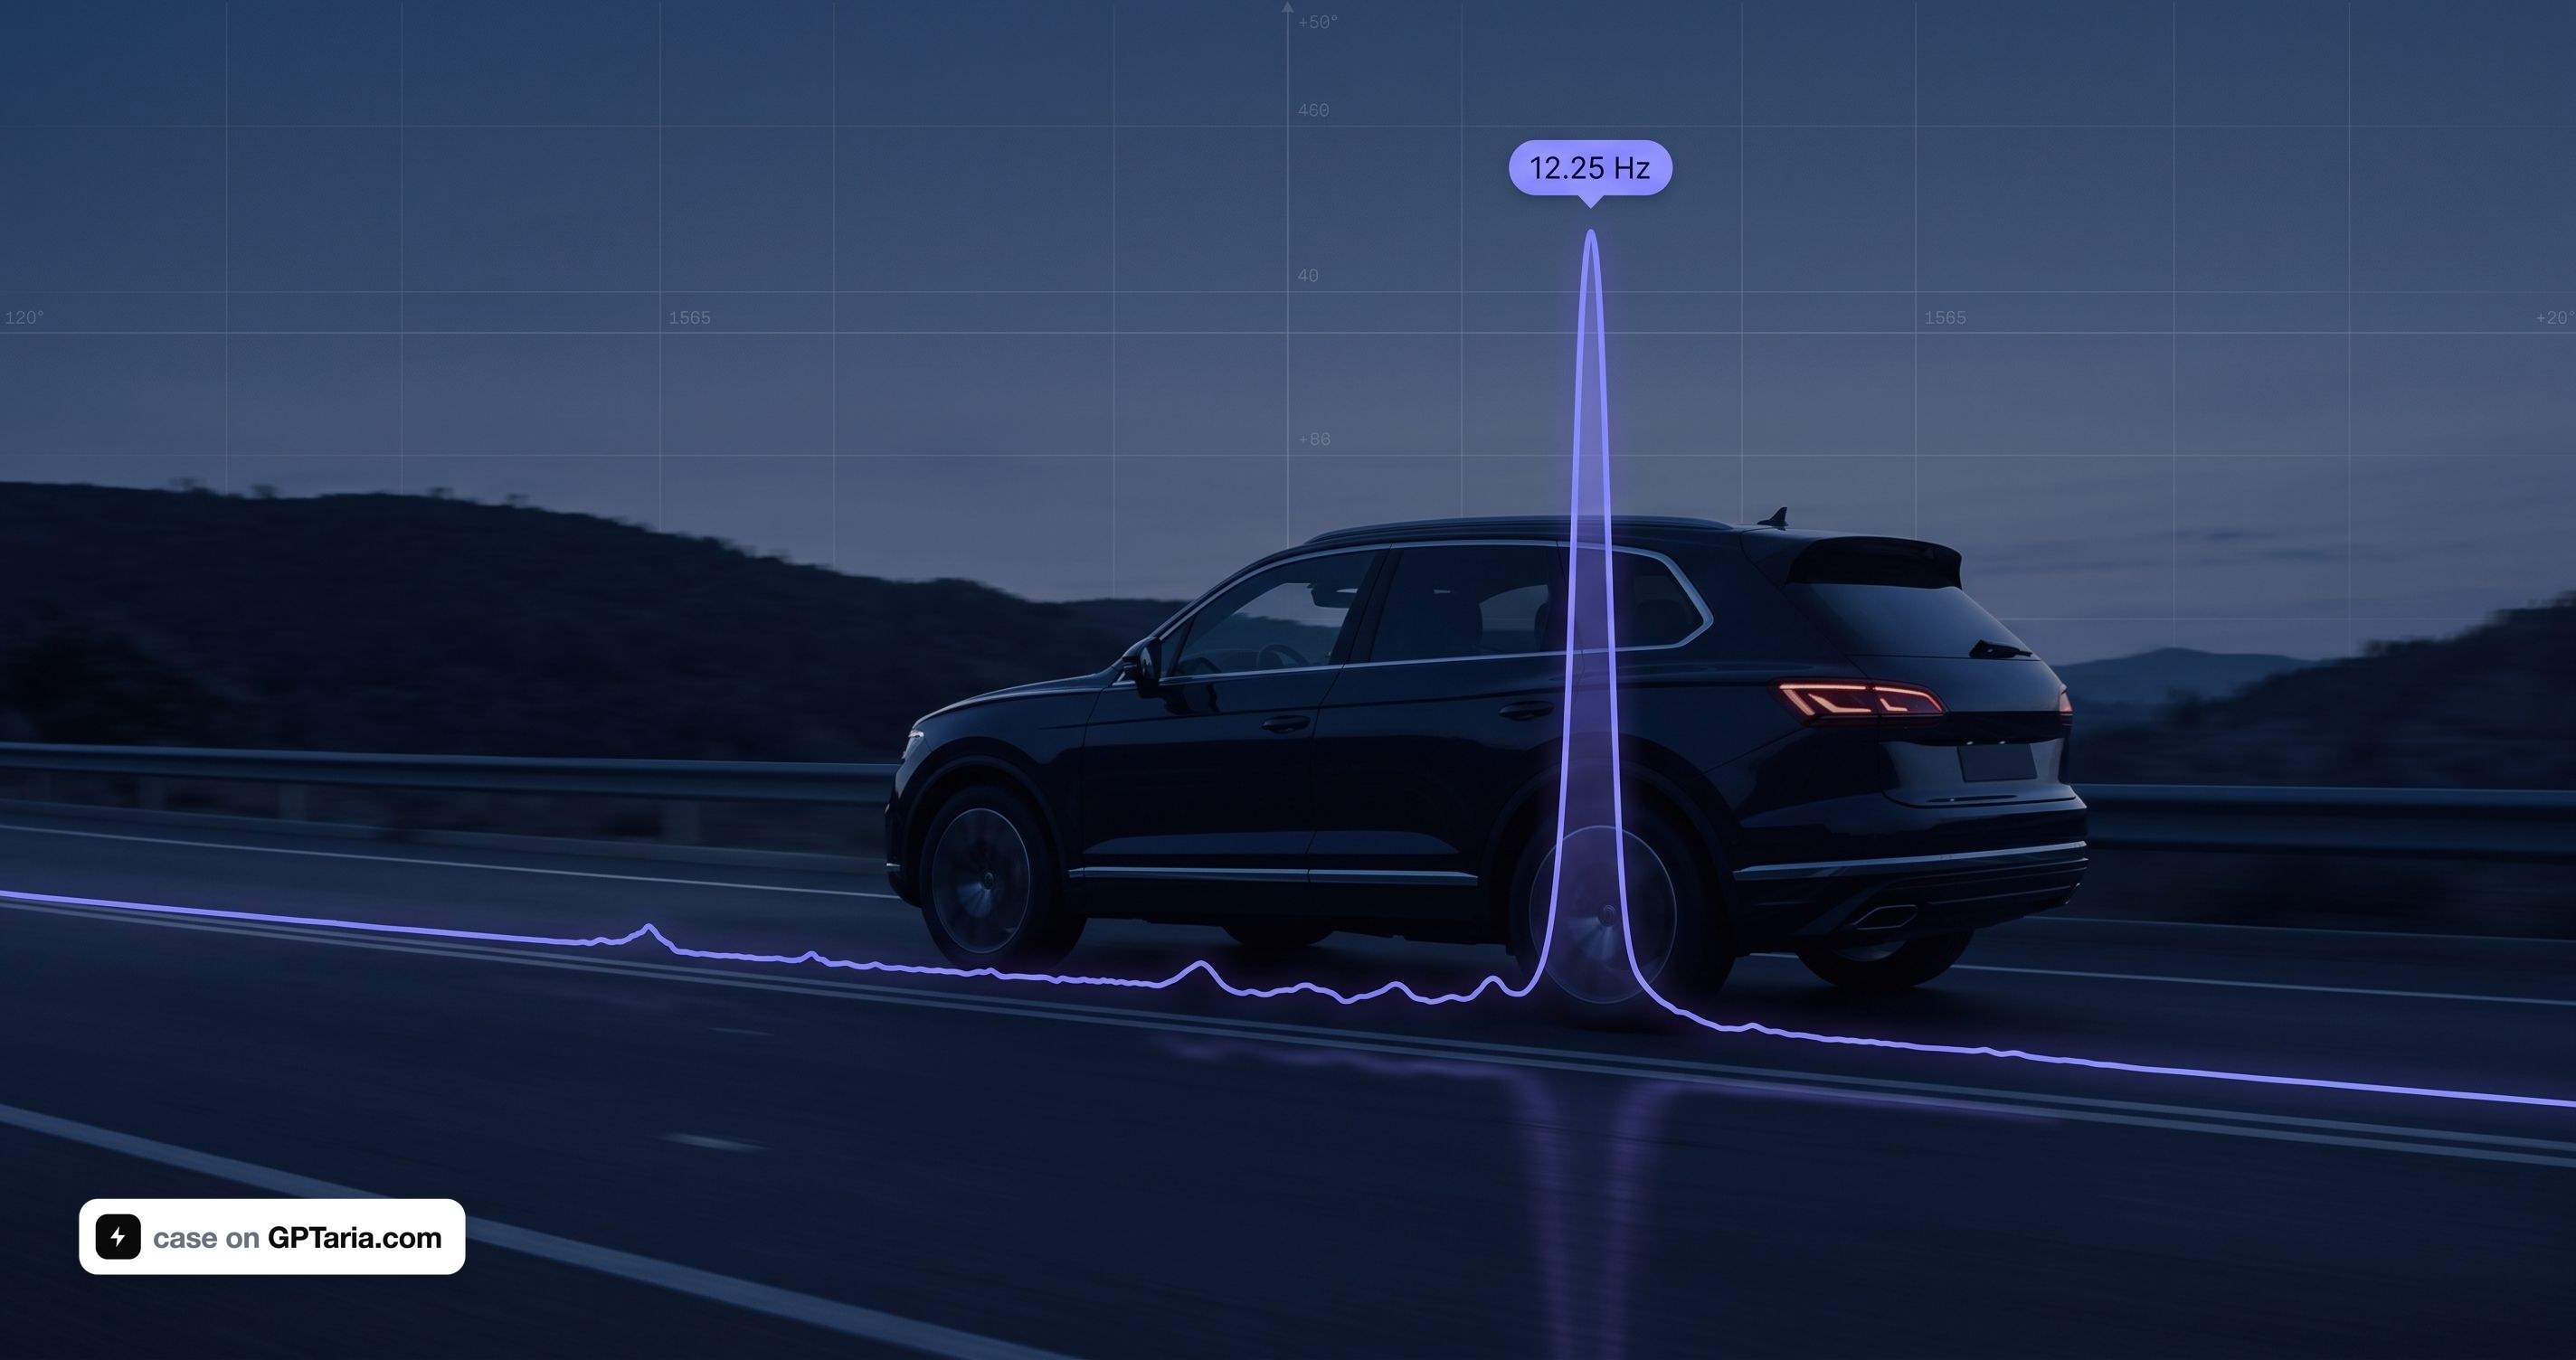

The method is universal and works on any modern car — BMW X5, Mercedes GLE, Range Rover, Tesla Model Y, Volvo XC90, Porsche Cayenne, VW Touareg, Ford Ranger, Toyota Land Cruiser. The make doesn't matter: the physics of wheel rotation is the same for all.
A Problem Unseen by Onboard Electronics
A modern premium car is packed with sensors. An Audi Q7 4M reads the speed of each wheel 48 times per revolution, knows the longitudinal and lateral acceleration of the body, the suspension height at four points, and the position of each pneumatic system valve. A diagnostic scanner will output hundreds of parameters in real-time.
Yet, the onboard system is fundamentally incapable of answering the question, "Why did a hum appear at 55 km/h?"
The reason lies in the architecture. Knock sensors on the engine block are broadband piezoelectric accelerometers with a bandwidth of 1–20 kHz, exactly what's needed for vibration analysis. However, the ECU processes their signal internally, within a narrow window around the top dead center of each cylinder, and only outputs the result: ignition timing correction angle. There's no raw data stream available through any protocol.
Body acceleration sensors are accessible as values, but they are read via UDS request-response at a rate of 5–20 values per second for all parameters combined. According to the Nyquist-Shannon sampling theorem, this is a ceiling of 2–10 Hz. A wheel defect at 50 km/h falls within the range of 6–25 Hz. It's physically impossible to construct a spectrum due to the insufficient sampling rate by an order of magnitude.
The conclusion that is important to accept immediately: the car's standard electronics are designed for control, not for vibration analysis. This is not a limitation of a specific scanner, but of the automotive data bus architecture itself. The onboard system cannot and does not see mechanical rolling defects.
This is where external measurement and AI processing come into play.
Why I Got Into This
I work as an engineer at Mind4Ship, a company specializing in predictive diagnostics of marine equipment. We attach industrial noise and vibration sensors to bearings, gearboxes, and shafts, capture spectra, run them through algorithms, and predict failures before they happen. A bearing defect is visible weeks before failure—through characteristic impact impulses in the envelope spectrum.

When a hum appeared in the area of the right rear wheel of my own Audi Q7 3.0 TDI with air suspension, my reaction was professional: this is exactly the task I solve at work, just with a different object.
But something else intrigued me. Could the same be achieved with everyday tools? Without industrial accelerometers costing €600 each, without an analyzer, without a field service team. A smartphone, school physics, and modern AI—would that be enough to diagnose the problem before a service visit?
Here's how it turned out.
The First Dead End: Apps That "Diagnose Themselves"
YouTube is full of videos about NVH (Noise, Vibration, Harshness) applications. You install one on your phone, drive, and the app says, "You have a front-left imbalance." Sounds great.
I studied the most popular one—NVH by Vibrate Software, $99.99. It has a database of 276 vibration sources, ready-made verdicts like "cause—consequence—solution." The iOS version is updated, has model databases up to 2026, and supports 303 electric vehicles.
And here's the first important decision that determined the entire method going forward.
Such an app sells a reference guide, not a measurement. It takes a spectrum, finds the dominant order, looks it up in its database, and provides a list of dozens of possible causes. It won't tell you which corner of the car the vibration is coming from. It won't provide raw data. It won't let you test your own hypothesis.
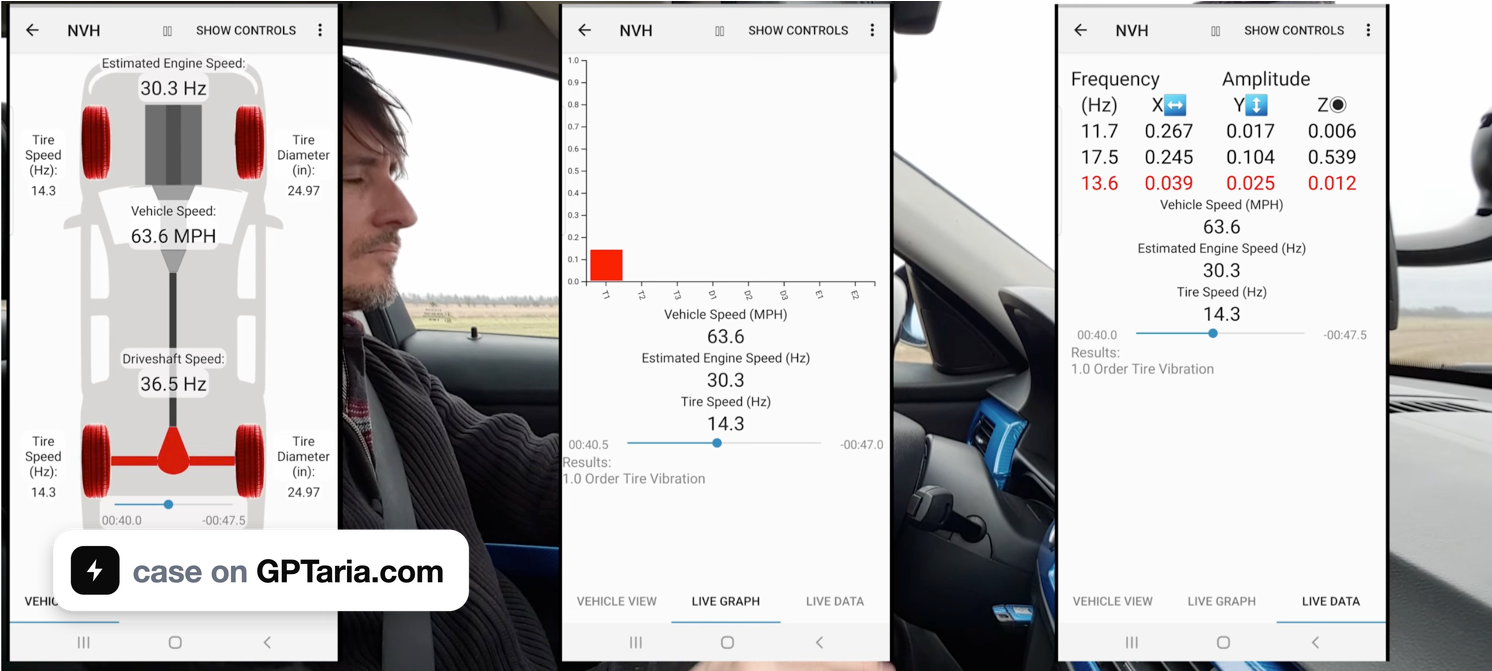
As an AI specialist, I understood: I need a raw accelerometer stream. With it, I can process the data with any algorithm and get a more accurate answer than any pre-made database. Without it, I'm a hostage to someone else's thresholds and logic.
Therefore, instead of a $99 reference guide, I opted for a €12 tool.
Choosing the Tool: An App That Simply Records Data
I settled on CarNVH (Android, com.motordoktor.carnvh). The choice was purely technical:
| CarNVH Pro €12 | NVH Vibrate $99 | |
|---|---|---|
| Raw data export | Yes | No |
| Envelope spectrum | Yes | No |
| Spectral kurtosis | Yes | No |
| Microphone up to 10 kHz | Yes | No |
| Orders per revolution | Yes | No |
| 2D Spectrogram | Yes | No |
| "276 causes" database | No | Yes |
The eightfold price difference—and the cheaper tool is objectively richer in measurement capabilities. Envelope analysis and kurtosis, used to detect bearing issues, are completely absent in the expensive app.
Hardware Check — The Step Everyone Skips
I didn't buy a new phone for the task. I had a Samsung Galaxy A51 lying around—it was my spare device after I switched to a new primary one. An ideal candidate: a dedicated device that I wouldn't mind taping to the trunk floor.
But before paying for the app, I needed to ensure the hardware was suitable.
Task: Determine the actual sampling rate of the accelerometer. Specifications often lie—manufacturers frequently limit the frequency in the system layer on mid-range models, even if the chip itself is capable of thousands of Hz. Moreover, starting with Android 12, the system defaults to limiting sensors to 200 Hz.
Tool: The free app phyphox, experiment "Acceleration Spectrum." It directly displays the data collection rate, no calculations needed.
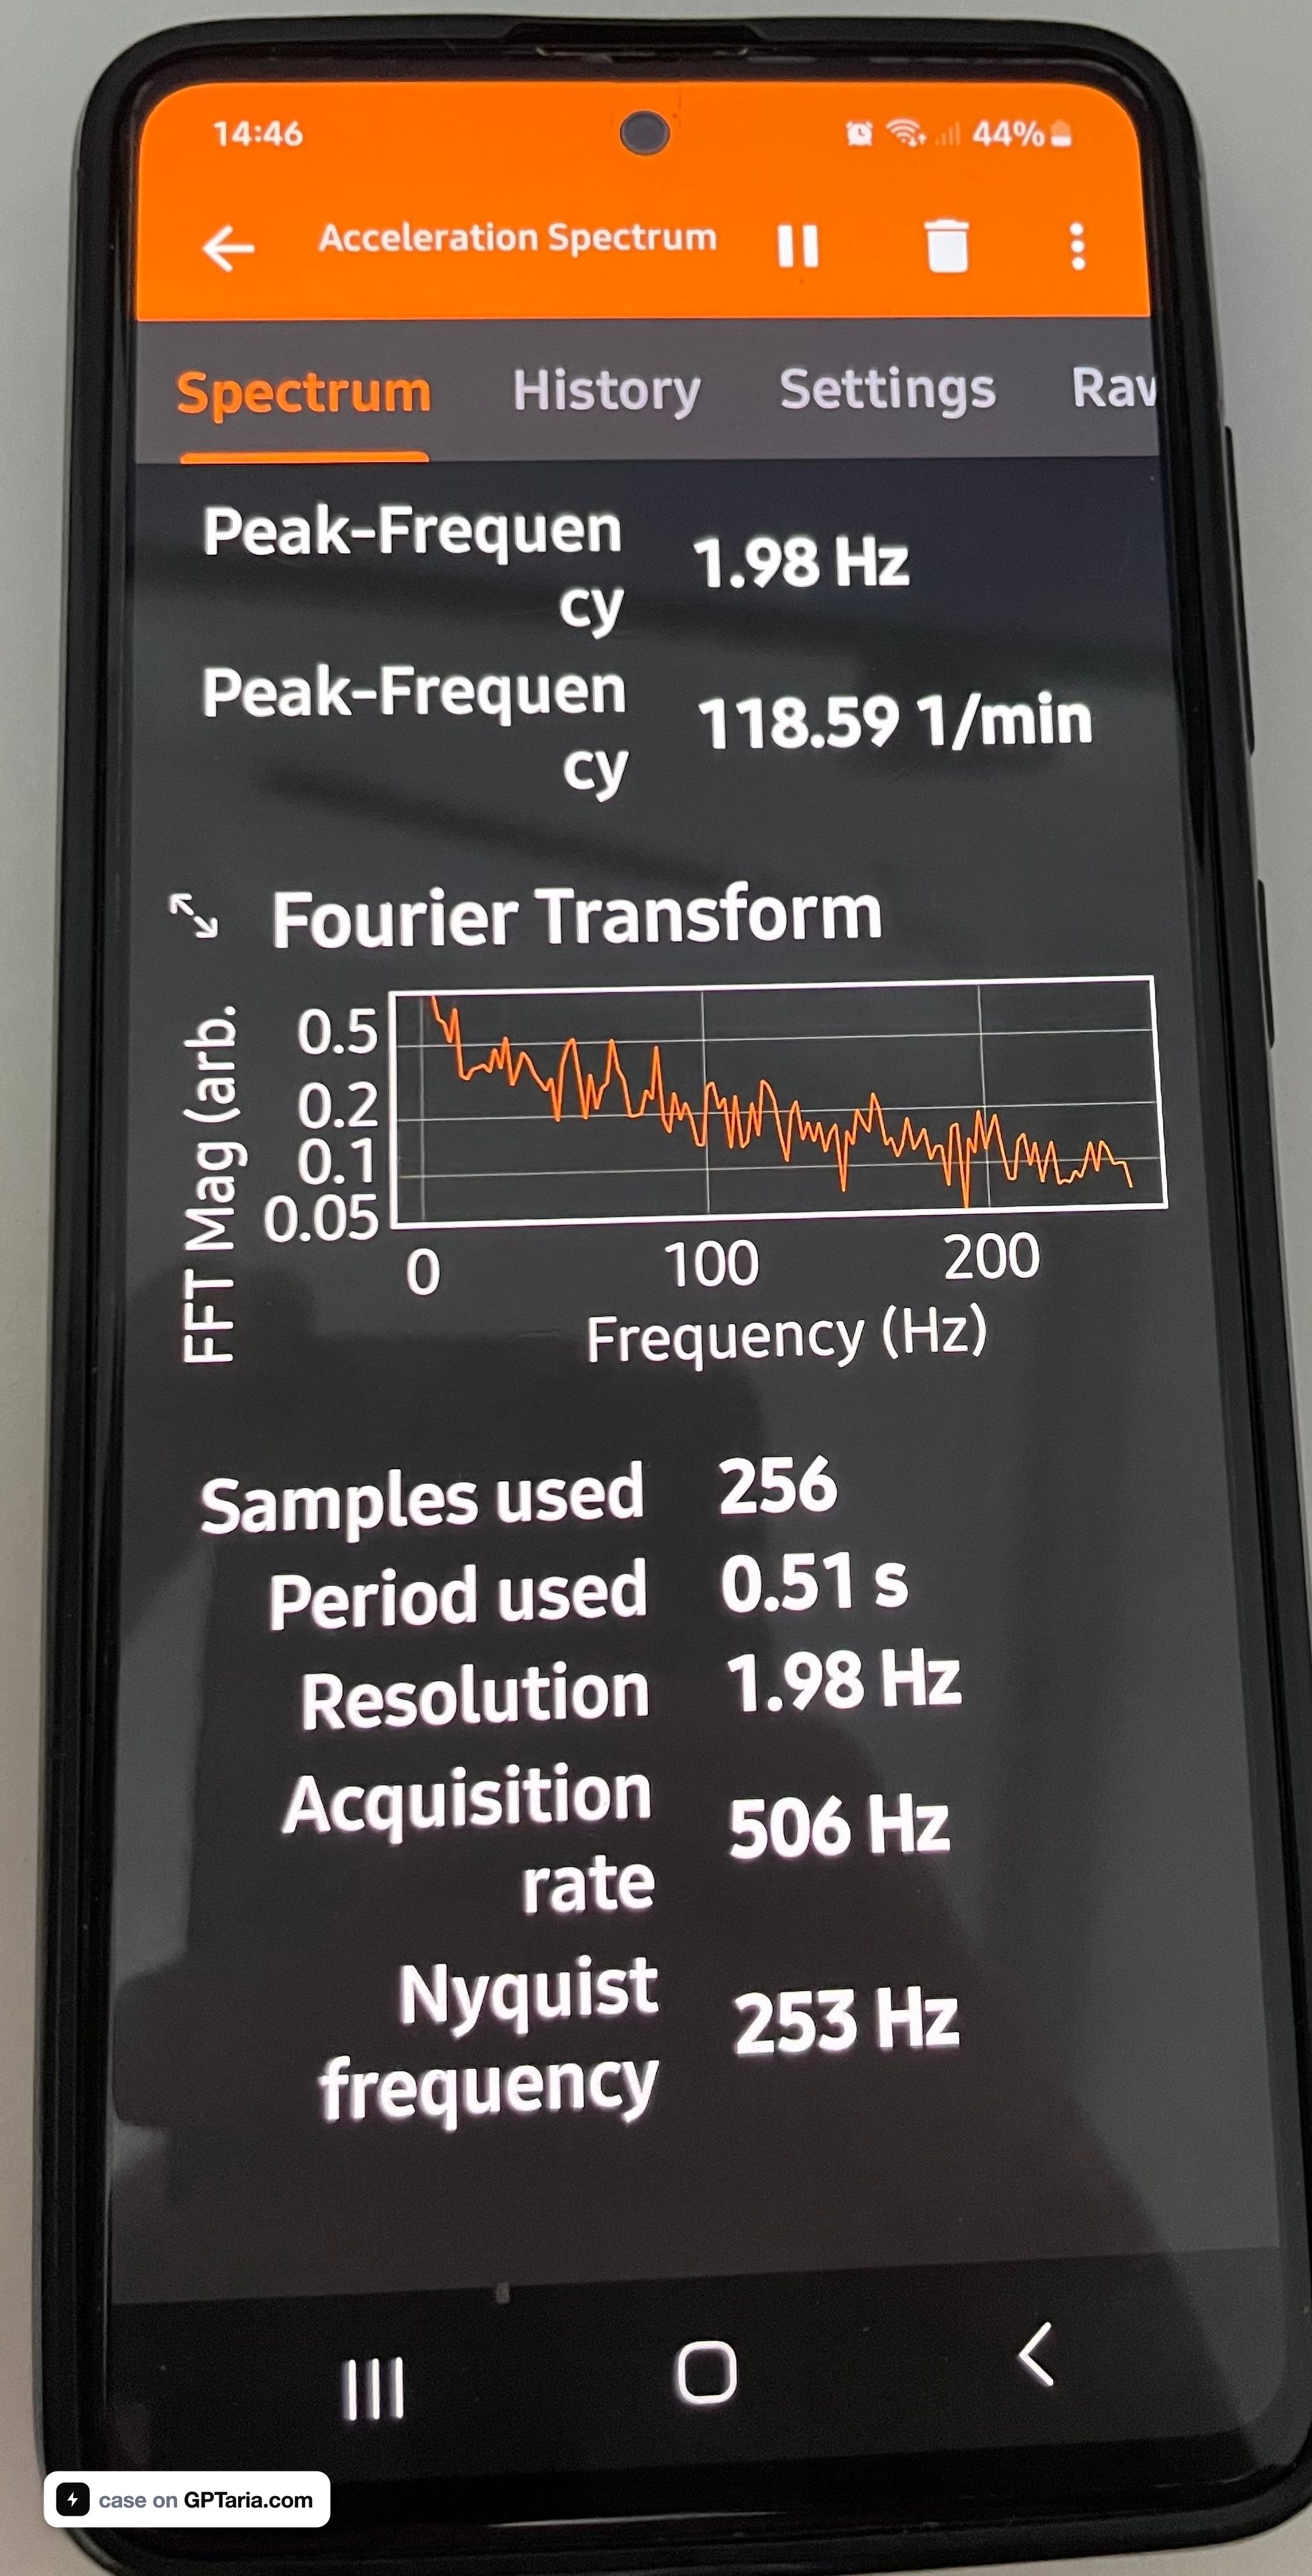
Result on the A51: 506 Hz, Nyquist frequency 253 Hz.
Let's check if this is sufficient. For a Q7 on 255/55 R19 at 55 km/h, the wheel rotates 6.65 times per second:
| Source | Frequency |
|---|---|
| 1× wheel rotation | 6.6 Hz |
| 3rd order of wheel rotation | 20 Hz |
| Bearing, outer ring | 23–30 Hz |
| Driveshaft | 40–60 Hz |
| Engine 2× at 2500 RPM | 83 Hz |
Everything needed falls below 100 Hz. Nyquist requires 200 Hz; we have 506 Hz—a fivefold margin. The phone is suitable; no need to buy anything.
Conclusion for those replicating the method: measure with phyphox first, then pay for the software. Five minutes of checking will determine whether you get a measurement or garbage.
Settings That Make All the Difference
CarNVH has a checkbox "Request High Sampling Rate." This requests the system permission HIGH_SAMPLING_RATE_SENSORS. Without it, Android limits the stream to 200 Hz regardless of hardware capabilities.
Other critical settings:
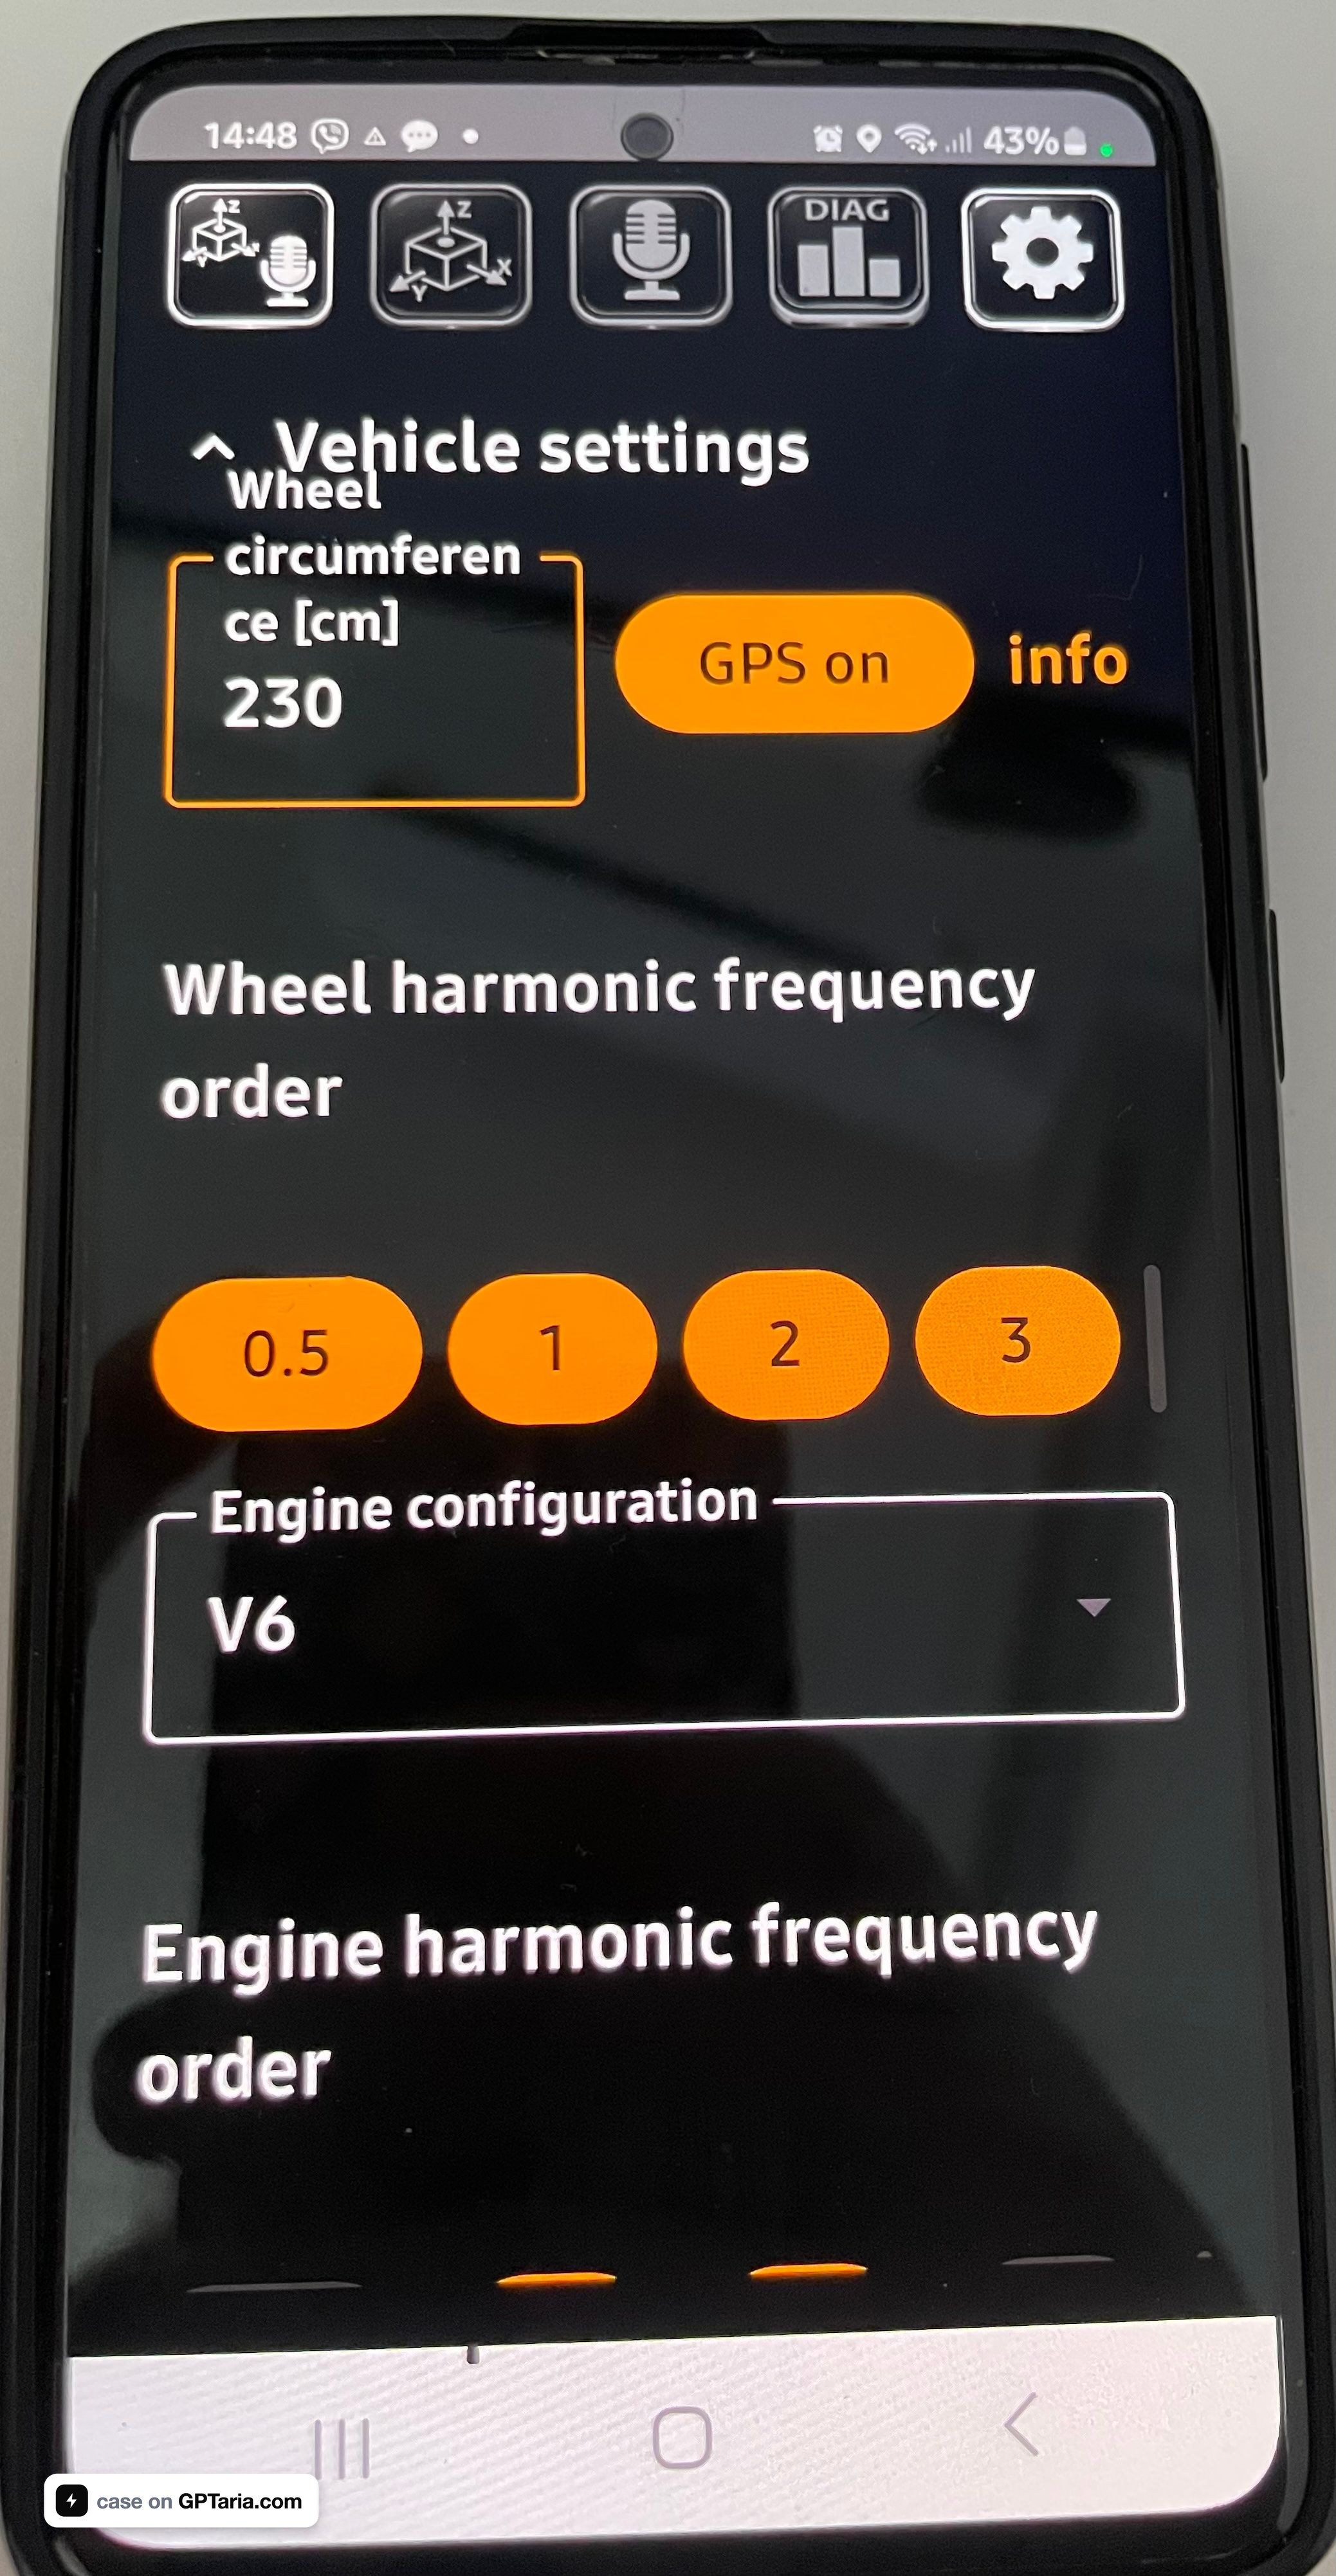
- Wheel circumference. For 255/55 R19: diameter = 19 × 25.4 + 2 × (255 × 0.55) = 763.6 mm, geometric circumference 2399 mm, working circumference with load sag ≈ 2300 mm
- Wheel orders: enable 0.5, 1, 2, 3 — otherwise, the app only shows a marker for the first order.
- Logarithmic X-axis — disable for vibration analysis (on a linear scale, harmonics form a uniform comb that's instantly visible) and enable for noise analysis (which covers 10 Hz–10 kHz).
- Autoscale Y — disable, fix at 0.2 m/s². Otherwise, two recordings cannot be compared by amplitude.
- Number of local maxima: 5
Mounting
This is half the measurement accuracy, and where most mistakes are made.
The phone is mounted rigidly to the floor or sill, screen up, long side forward, using 3M VHB double-sided tape or strong Velcro.
The mounting location determines the output. On my first trip, I placed the phone in the center of the trunk floor—this was a mistake worth avoiding.
The center of the trunk is equidistant from both rear wheel wells, so vibrations from the left and right wheels arrive there with roughly equal intensity. Such a recording answers questions like "Is there a defect?", "What order is it?", and "Is it related to the engine?", but it doesn't answer which of the two wheels is at fault. This requires another drive later.
The correct approach from the start:
- First recording — phone placed close to the wheel well from which the noise is suspected. Not in the center, but shifted as far as possible towards the suspect wheel, within the trunk floor's limits.
- Second recording — near the opposite wheel well. Same route, same speed, same fixed Y-scale, same phone orientation.
Comparing the amplitude at the target frequency between the two recordings reveals the side: where it's higher, that's where the defect is. The difference is usually multiplicative, making it hard to err.
Autoscale must be disabled for both recordings—otherwise, the app will adjust the scale for each trip separately, rendering the comparison meaningless.
What doesn't work: suction cup mounts and flexible goosenecks (mechanical filters that cut off everything above 20 Hz and add their own resonance), seats and carpeted floors (foam dampens precisely the desired range), hands (hand tremor creates a stable 8–12 Hz peak—I saw this on the very first test).
Axes after mounting: Z vertically—primary for bearings and runout; Y along the car's length; X transversely, important for the load transfer test.
Recording: Route and Initial Pitfalls
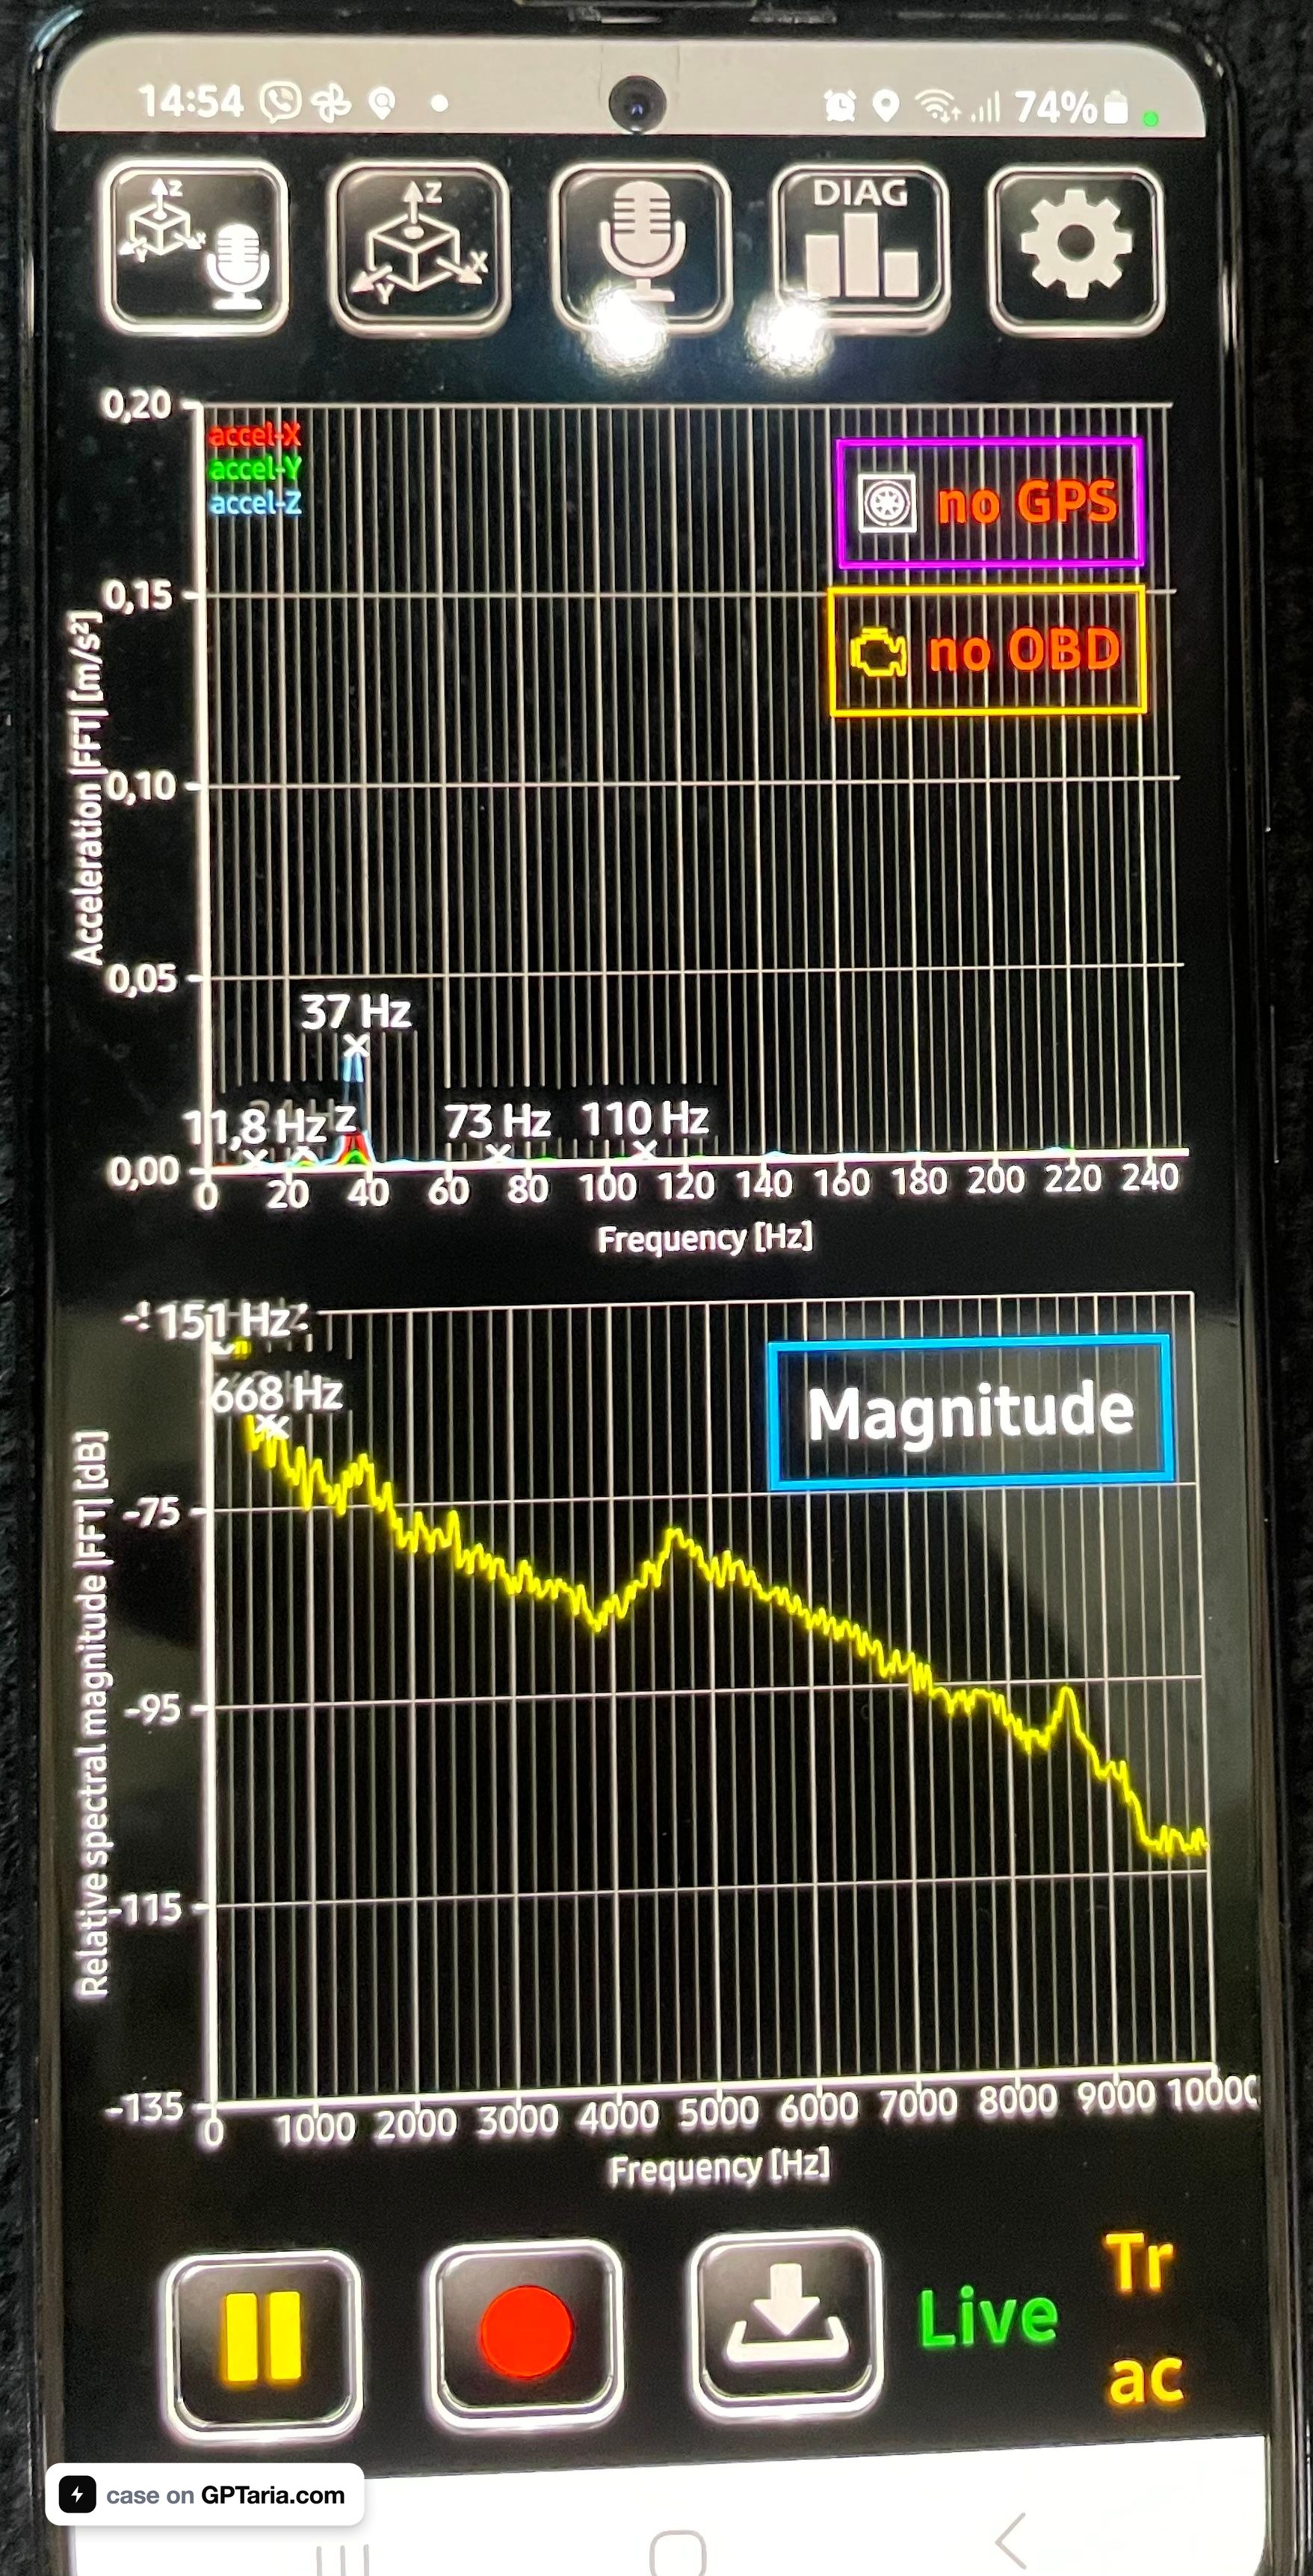
The procedure is simple: start recording while stationary, drive the route without touching the phone, return, stop, save. No need to split the trip into files—everything is analyzed later by time and RPM.
A 4–6 minute route:
| Segment | Action | What it reveals |
|---|---|---|
| 0–1 min | Stationary, engine running | baseline, engine harmonics |
| 1–2 min | Smooth acceleration | shows if the peak grows linearly or is a resonant hump |
| 2–3 min | Constant speed, smooth asphalt | clean spectrum |
| 3–4 min | Coasting in neutral | separates rolling noise from transmission noise |
| 4–5 min | Constant speed, rough asphalt | where the defect is audible |
| 5–6 min | Smooth S-turns left and right | load transfer, determining the side |
First pitfall: the file turned out to be 145.7 MB for 4.2 minutes. Text format, full float precision, three axes at 500 Hz plus a microphone at 5.7 kHz. This cannot be uploaded to an AI chat, opened in Excel, or processed manually.
Second pitfall: GPS was not recorded. The app lacked permission for precise location. Only engine RPM was recorded via the OBD adapter—679 values at a frequency of 3 Hz.
Both problems were solved programmatically, and the second one unexpectedly turned out to be a gift.
Tool 1: Data Preparation
I wrote a script nvh_prep.py (code in the method's repository). The task is to transform 145 MB of raw data into a few megabytes suitable for analysis, without losing anything.
What it does:
Parses the format. CarNVH writes .txt with a semicolon delimiter without quotes and .csv with a comma and quoted data fields. The script determines the format automatically.
Stitches overlapping frames. The app doesn't write a continuous stream but windows of 256 samples with a step of about 52 ms. Adjacent windows overlap: each contains only 26 new samples out of 256. The script finds the shift by correlation and reconstructs a continuous signal.
Calculates the actual sampling rate. Not by total duration (which overestimates due to jitter), but by the ratio of "new samples per frame" to the time step between frames. The result was exactly 500.0 Hz—meaning High Sampling Rate actually worked.
Discards the microphone. It takes up most of the volume, while the accelerometer is the crucial channel for distinguishing between wheel/tire noise and bearing noise.
Cuts into segments of 20 seconds, evenly distributed throughout the recording, and separately saves all OBD recordings in full.
Result: instead of 145.7 MB, a 17 KB report, 2.6 MB of segments, and 20 KB of OBD data.
Tool 2: Order Analysis
The second script, nvh_analyze.py, performs the actual diagnostics. The logic follows four steps.
Step 1. Engine RPM Correlation Test
The key idea of the entire method, and it provides an answer before any spectrum analysis.
All vibration sources are divided into two classes: those tied to engine RPM (mounts, damper, accessories, exhaust) and those tied to vehicle speed (wheels, tires, bearings, driveshaft).
They can be separated with a single maneuver—a kickdown. With a sudden acceleration, RPMs double while speed changes very little over a couple of seconds. If the peak frequency follows the RPMs, the source is in the engine. If it stays put, the source is in the rolling components.
Here's what my data showed:
| Segment | RPM | Peak Frequency |
|---|---|---|
| 3 | 1184 → 2418 | 13.00 → 13.00 Hz |
| 6 | 777 → 2070 | 5.00 → 11.00 Hz |
| 2 | 717 → 1788 | 25.00 → 14.50 Hz |
Average RPM increase: ×2.39. Average frequency shift: ×1.00.
RPMs more than doubled—the frequency didn't shift. Engine, transmission, and driveshaft are ruled out in one iteration, without any disassembly.
Step 2. Order Analysis
Next, a segment with stable speed is taken—the script selects it based on the criterion "maximum amplitude with minimum RPM variation." For me, this was 20 seconds at 51 km/h.
The spectrum is decomposed by multiples of the wheel rotation frequency:
Order   Frequency       Z        X        Y     Z/background
   1x      6.45 Hz    0.1020   0.0252   0.0192    2.3
   2x     12.25 Hz    0.4416   0.0574   0.1205   10.1
   3x     18.20 Hz    0.0705   0.0111   0.0039    1.6
   4x     24.70 Hz    0.1170   0.0264   0.0178    2.7
   5x     30.50 Hz    0.0830   0.0471   0.0230    1.9
Additionally, the Q-factor of the main peak is calculated: Q = 122, bandwidth at -3 dB is only 0.10 Hz. This is a narrow discrete line, not a resonant hump. For comparison, during acceleration on rough asphalt, Q drops to 1.4—that's suspension resonance, and it shouldn't be confused with a defect.
Step 3. Envelope Analysis — Bearing Check
A bearing defect is not vibration but impact pulses. These manifest as modulation of a high-frequency carrier and are only detected through demodulation: band-pass filtering, Hilbert transform, envelope spectrum.
The script performs this in the 60–240 Hz and 100–240 Hz bands and looks for discrete lines. The most important sign: bearing defect frequencies are not integer multiples of wheel rotation—the outer ring is typically 3.5–4.5×, the inner ring 5.5–6.5×. Integer orders are unrelated to bearings.
In my data, the maximum envelope peak is 8.6 times the background median; there are no discrete lines. Bearing ruled out.
Step 4. Verdict
The script correlates the dominant order with a mechanical cause and compares the amplitude to thresholds (0.30 m/s²—noticeable, 0.50—defect).
Result and an Error That Almost Led Me Astray
The first run yielded an incorrect answer, and it's worth showing why.
The script found a dominant line at 12.25 Hz and by default assumed it was the first order of the wheel. This implied a speed of 101 km/h and a diagnosis of "imbalance."
The diagnosis would have been incorrect. With a circumference of 2.30 m, the first order at 60 km/h is 7.25 Hz—and I didn't exceed 60 km/h on this drive. Therefore, 12.25 Hz physically cannot be the first order.
The only consistent explanation: 12.25 Hz is the second order, the first order is 6.125 Hz, speed ≈ 51 km/h.
Independent verification through the transmission:
- Wheel RPM at 6.125 Hz = 368 RPM
- Total gear ratio = 1460 / 368 = 3.97
- 5th gear of 8HP: 1.285 × 3.204 final drive = 4.12
A 4% discrepancy—within the tolerance for tire circumference. 5th gear at 51 km/h at 1460 RPM is absolutely normal. The hypothesis is confirmed.
Recalculated picture:
- First order: 0.083 m/s², practically at background level → imbalance ruled out
- Second order: 0.442 m/s², 10 times higher than background → dominant
- Direction: 71% vertical → radial unevenness, not lateral
The second wheel order with a clean first order means: tire ellipticity, wear at two opposite points, rim deformation at two points, or the beginning of tread separation.
The symptoms match perfectly. The hum appears at 50–60 km/h—measured precisely at 51 km/h. It doesn't react to throttle—proven by the kickdown test. The range is narrow—12.25 Hz falls within the natural frequency range of the unsprung rear axle mass, which is why the defect resonates most strongly there, while higher and lower frequencies fall out of resonance.
Balancing won't help here: it corrects the first order, which is clean. A radial runout measurement on a balancer is needed, separately for the tire and the assembled wheel.
The Role of AI in This Work
It's important to be precise because there's a lot of mystique around the topic.
AI did not "hear the failure." Claude did not replace a sensor or a runout balancer.
What it actually did:
- Set measurement requirements. Calculating the necessary sampling rate based on defect frequencies, mounting requirements, and the set of maneuvers in the route—all this is determined by the physics of the problem, and an error here devalues any subsequent processing.
- Wrote both tools. The scripts for parsing overlapping frames and for order analysis with Hilbert transform would have taken hours of manual work; here, it took minutes.
- Performed the analysis itself. Engine RPM correlation test via kickdown, Q-factor calculation, envelope analysis, gear ratio cross-check—the entire analytical part.
- Caught its own error based on a single remark. The phrase "I didn't go faster than 60" completely changed the interpretation: the diagnosis shifted from the first order to the second, from imbalance to ellipticity. This is a key point—AI tests hypotheses against physics, rather than defending them.
The division of labor was fair: the human provides context and physical constraints, AI calculates and checks for consistency. Without the remark about 60 km/h, the diagnosis would have been elegant and incorrect.
The Bottom Line: What the Method Costs
| Item | Price |
|---|---|
| CarNVH Pro | €12 |
| phyphox | Free |
| Smartphone | Old A51, already owned |
| OBD adapter | Already owned, and ultimately not needed |
| Scripts | Written once, reusable |
| Total | €12 |
Compared to $99.99 for a reference app that doesn't provide raw data, and a service visit with the statement "there's a hum from the back."
The method is transferable to any car without changes. Only two numbers change: wheel circumference and gear ratios. The physics of rotation are the same for Audi Q7, BMW X5, Mercedes GLE, Range Rover, Tesla Model Y, Volvo XC90, Porsche Cayenne, VW Touareg, Ford Ranger, Toyota Land Cruiser, and any other car.
For Range Rovers, Q7s, Touaregs, Cayennes, and other SUVs with air suspension, there's an additional condition: maintain a single height mode throughout the drive. Changing the ground clearance alters driveshaft angles and suspension load, making recordings incomparable.
For electric vehicles, the method works even better: the engine is silent, mechanical sources are heard as if in a lab, and the RPM correlation test is entirely unnecessary.
What's Next
The next step is determining the side, and here I'm paying the price for placing the phone in the center of the trunk. Such a point is equidistant from both wheel wells and doesn't isolate the side. Two recordings are needed, shifted towards the right and left wheel wells, at the same speed, with the same fixed scale. The amplitude difference at 12.25 Hz will indicate the wheel.
And a mandatory control measurement after repair: the same stretch of road, the same speed, the same settings. If the peak at 12.25 Hz drops to background level—the defect has been objectively eliminated, not just "seems quieter." This is precisely how predictive diagnostics work on ships, and this exact principle is fully transferable to cars.
The scripts nvh_prep.py, nvh_analyze.py, and the full technical description of the method are published on GitHub: github.com/gptariacom/car-nvh-order-analysis (MIT).
Author—engineer at Mind4Ship, predictive diagnostics of marine equipment.
Like this case?
Start a similar project — describe "I want the same", and builders will send working prototypes. A link to this case is already in the brief.
Order a similar project